2020 US Presidential Election Survey
A study conducted by Compughter Technologies, LLC
Design of the Model
In this model, we seek to determine public sentiment on which candidate Americans really want to see in the Office of President. Our model was one of the few to accurately predict the outcome of the 2016 Presidential Election. For 2020, our field of hypothetical presidential candidates expanded from eight to fourteen. Six Democrats, six Republicans, and two third party candidates (Libertarian and Green Parties) were chosen for the study. Joe Biden and the incumbent President Donald Trump were also included among the hypothetical candidates, as the study was ulteriorly aimed at predicting which of those candidates would win in the actual 2020 presidential election.
The hypothetical candidates chosen for the study were (in alphabetical order):
- Alexandria Ocasio-Cortez (D)
- Bernie Sanders (D)
- Donald Trump (R)
- Elizabeth Warren (D)
- Hillary Clinton (D)
- Howie Hawkins (G)
- Jo Jorgensen (L)
- Joe Biden (D)
- Kamala Harris (D)
- Lindsey Graham (R)
- Mike Pence (R)
- Mitch McConnell (R)
- Ted Cruz (R)
The candidates in the study were randomly pitted against each other in head to head “match-ups” and presented to study participants. It was critical to ensure that the study participants were identified randomly and without bias. This was accomplished by creating a "custom audience" targeted broadly at individuals living in the US and over the age of 18.
Each participant voted on five randomly generated match-ups, which prevented participants from purposefully choosing and voting for or against particular candidates. Participants were limited to five votes per day, but were allowed to vote again on subsequent days. The survey began on July 19, 2020 and concluded on August 19, 2020.
Crunching the Numbers
An iterative mathematical algorithm was employed to compute a performance rating for each of the candidates based on their wins and losses against their hypothetical opponents. Each candidate was then ranked according to their performance rating. It’s important to note that simply tallying the votes for each candidate would be insufficient by itself for measuring voter sentiment or predicting outcomes. The algorithm needs to take into consideration the relative strength of each candidate’s opponents, and the strength of their opponents’ opponents, and so on.
View the Latest Rankings
Simulate the 2020 Election Now!
2020 Presidential Election
Survey Results
Classic polling systems are often biased and inherently flawed. Our model uses a mathematical concept called Game Theory to measure public sentiment about who Americans would like to see in the Office of President. And it was one of the few to accurately predict the 2016 Presidential Election. Check out the results and simulate the election now!
View the Results
Simulate the Election
Week 6: Thursday August 20, 2020
| Rank | Candidate | Rating | W | L | T | Prev | Chng | Pwr | Off | Def |
|---|---|---|---|---|---|---|---|---|---|---|
| 1 1 |  Tim Scott (R) Tim Scott (R)Republican Tim Scott (R) 13-0-0 Pwr: 1 | Off: 1 | Def: 2 | 2.95 | 13 | 0 | 0 | 2 | 1 | 1 | 1 | 2 |
| 2 1 |  Ted Cruz (R) Ted Cruz (R)Republican Ted Cruz (R) 11-2-0 Pwr: 2 | Off: 3 | Def: 3 | 1.96 | 11 | 2 | 0 | 1 | 1 | 2 | 3 | 3 |
| 3 |  Mike Pence (R) Mike Pence (R)Republican Mike Pence (R) 9-4-0 Pwr: 3 | Off: 4 | Def: 4 | 1.14 | 9 | 4 | 0 | 3 | 3 | 4 | 4 | |
| 4 |  Donald Trump (R) Donald Trump (R)Republican Donald Trump (R) 9-4-0 Pwr: 4 | Off: 2 | Def: 7 | 1.12 | 9 | 4 | 0 | 4 | 4 | 2 | 7 | |
| 5 |  Howie Hawkins (G) Howie Hawkins (G)Third Party Howie Hawkins (G) 9-4-0 Pwr: 5 | Off: 13 | Def: 1 | 1.11 | 9 | 4 | 0 | 5 | 5 | 13 | 1 | |
| 6 4 |  Jo Jorgensen (L) Jo Jorgensen (L)Third Party Jo Jorgensen (L) 7-6-0 Pwr: 8 | Off: 11 | Def: 5 | 0.35 | 7 | 6 | 0 | 10 | 4 | 8 | 11 | 5 |
| 7 1 |  Lindsey Graham (R) Lindsey Graham (R)Republican Lindsey Graham (R) 7-6-0 Pwr: 9 | Off: 6 | Def: 10 | 0.35 | 7 | 6 | 0 | 6 | 1 | 9 | 6 | 10 |
| 8 1 |  Joe Biden (D) Joe Biden (D)Democrat Joe Biden (D) 6-7-0 Pwr: 6 | Off: 5 | Def: 8 | -0.01 | 6 | 7 | 0 | 7 | 1 | 6 | 5 | 8 |
| 9 1 |  Mitch McConnell (R) Mitch McConnell (R)Republican Mitch McConnell (R) 6-7-0 Pwr: 12 | Off: 9 | Def: 13 | -0.05 | 6 | 7 | 0 | 8 | 1 | 12 | 9 | 13 |
| 10 1 |  Elizabeth Warren (D) Elizabeth Warren (D)Democrat Elizabeth Warren (D) 5-8-0 Pwr: 7 | Off: 7 | Def: 6 | -0.38 | 5 | 8 | 0 | 11 | 1 | 7 | 7 | 6 |
| 11 2 |  Kamala Harris (D) Kamala Harris (D)Democrat Kamala Harris (D) 4-9-0 Pwr: 10 | Off: 8 | Def: 9 | -0.77 | 4 | 9 | 0 | 9 | 2 | 10 | 8 | 9 |
| 12 |  Bernie Sanders (D) Bernie Sanders (D)Democrat Bernie Sanders (D) 3-10-0 Pwr: 11 | Off: 10 | Def: 12 | -1.18 | 3 | 10 | 0 | 12 | 11 | 10 | 12 | |
| 13 1 |  Hillary Clinton (D) Hillary Clinton (D)Democrat Hillary Clinton (D) 2-11-0 Pwr: 13 | Off: 12 | Def: 11 | -1.62 | 2 | 11 | 0 | 14 | 1 | 13 | 12 | 11 |
| 14 1 |  Alexandria Ocasio-Cortez (D) Alexandria Ocasio-Cortez (D)Democrat Alexandria Ocasio-Cortez (D) 0-13-0 Pwr: 14 | Off: 14 | Def: 14 | -2.60 | 0 | 13 | 0 | 13 | 1 | 14 | 14 | 14 |
Demographics
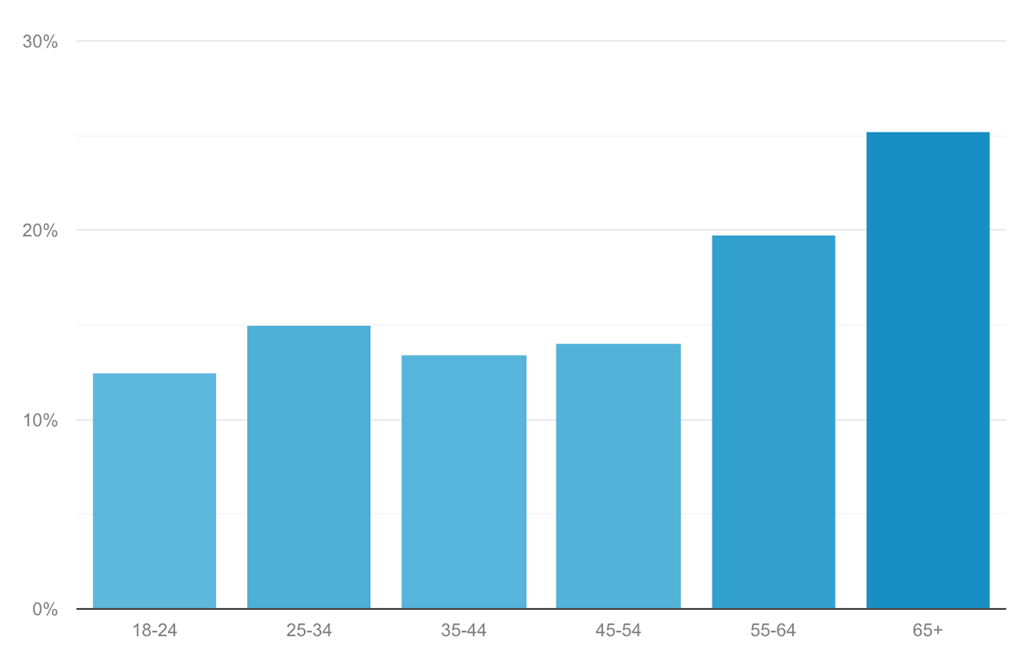
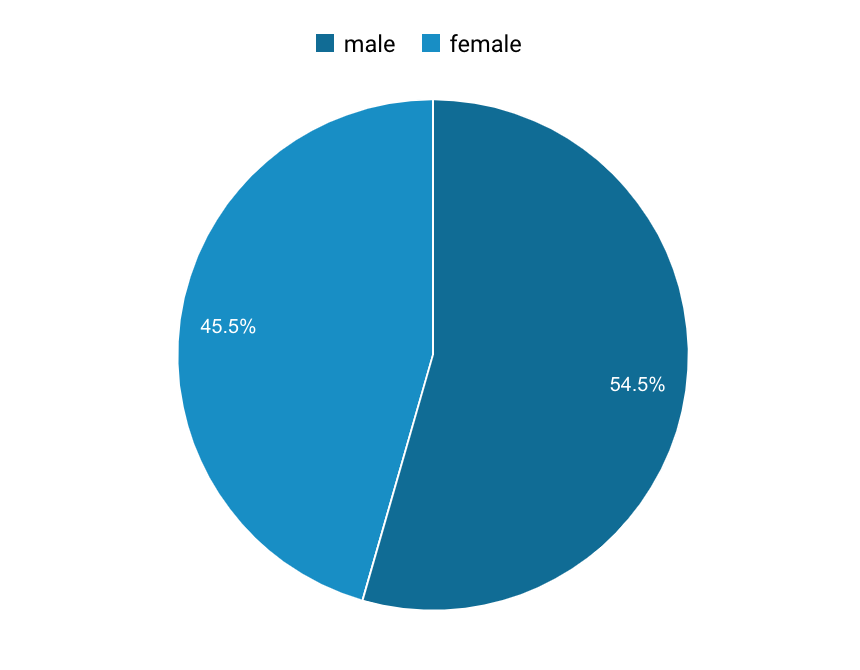
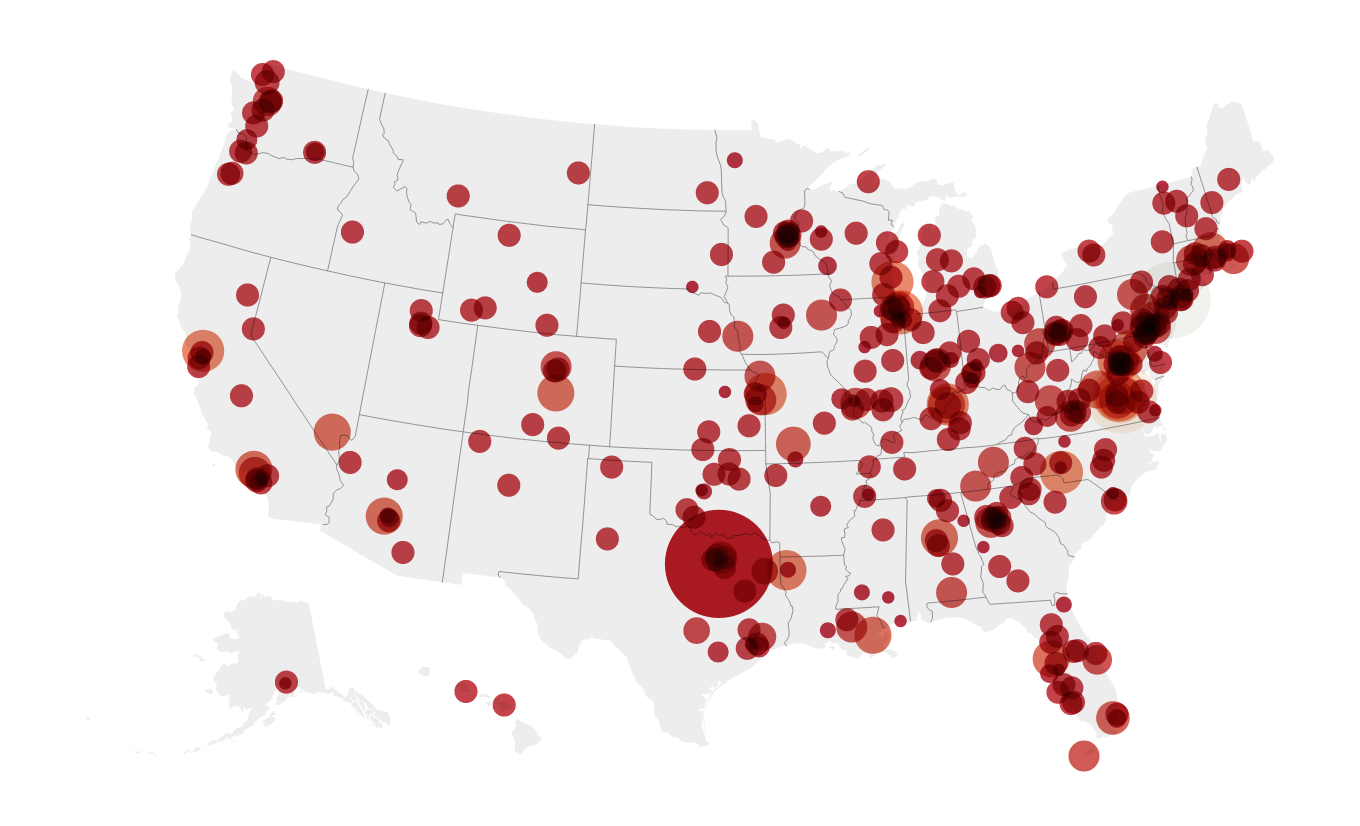
The following charts depict the demographics of the participants targeted for the study once a large enough sample of data was collected (around August 9, 2020). At the time of this publication, the age, gender, and location of the participants are well distributed. This is paramount to the effectiveness of the "Game Theory" model being employed here and enables us to make insightful predictions about nationwide voter sentiment.
Age

Gender

Location

Predicted Outcomes
Based on the votes of the study participants and subject to the stated demographics, the algorithm predicted the outcome of every possible matchup between the fourteen hypothetical candidates. During the month-long survey, we were able to collect a large enough sample size of data to predict the outcome of the 2020 Presidential Election with 95% confidence. The following table depicts the current snapshot of expected results.
Donald Trump (R) vs Joe Biden (D)
| Candidate | Donald Trump | Joe Biden |
|---|---|---|
| Party | Republican | Democrat |
| Projected Electoral Votes |
290 (54%) | 248 (46%) |
| Probability of Win | 68% | 32% |