2016 Presidential Election Poll
A study conducted by Compughter Technologies, LLC
Design of the Study
In this study, we sought to determine public sentiment on which candidate Americans really want to see in the Office of President. Eight hypothetical presidential candidates were chosen for the study: four Republicans and four Democrats. To establish a control in the study, the incumbent President Barack Obama was chosen as one of the four Democrats. Hillary Clinton and Donald Trump were also included among the hypothetical candidates, as the study was ulteriorly aimed at predicting which of those candidates would win in the actual 2016 presidential election. The chosen candidates for the study were:
- Barack Obama (D)
- Bernie Sanders (D)
- Donald Trump (R)
- Hillary Clinton (D)
- Jeb Bush (R)
- Mike Pence (R)
- Paul Ryan (R)
- Tim Kaine (D)
The eight candidates in the study were randomly pitted against each other in head to head “match-ups” and presented to study participants. Each participant voted on three randomly generated match-ups, which prevented participants from purposefully choosing and voting for or against particular candidates. The study was conducted from Sunday 10/23/2016 through Sunday 10/30/2016 and more than 2,700 votes were tallied.
Crunching the Numbers
An iterative mathematical algorithm was employed to compute a performance rating for each of the candidates based on their wins and losses against their hypothetical opponents. Then, each candidate was ranked according to their performance rating. It’s important to note that simply tallying the votes for each candidate would have been insufficient by itself for measuring voter sentiment or predicting outcomes. The algorithm needed to take into consideration the relative strength of each candidate’s opponents, and the strength of their opponents’ opponents, and so on.
Candidate Performance Rankings
The table below outlines the results of the algorithm after being applied to the poll data. It depicts the actual number of votes for and against each candidate. In addition, the record of head to head wins and losses is listed.
| Rank | Candidate | Rating | Votes For | Votes Against | Votes For % | Wins | Losses | Win % | Off Ranking | Off Rating | Def Ranking | Def Rating |
|---|---|---|---|---|---|---|---|---|---|---|---|---|
| 1 | Paul Ryan (R) | 0.72 | 428 | 293 | 59% | 6 | 1 | 86% | 2 | 41.13 | 1 | -13.38 |
| 2 | Mike Pence (R) | 0.67 | 427 | 302 | 59% | 6 | 1 | 86% | 1 | 41.17 | 3 | -14.67 |
| 3 | Jeb Bush (R) | 0.44 | 379 | 329 | 54% | 5 | 2 | 71% | 3 | 34.73 | 4 | -17.61 |
| 4 | Barack Obama (D) | 0.44 | 350 | 310 | 53% | 3 | 4 | 43% | 6 | 27.97 | 2 | -14.66 |
| 5 | Bernie Sanders (D) | 0.27 | 350 | 361 | 49% | 3 | 4 | 43% | 4 | 31.17 | 7 | -21.67 |
| 6 | Donald Trump (R) | 0.26 | 337 | 347 | 49% | 3 | 4 | 43% | 5 | 28.98 | 6 | -19.36 |
| 7 | Tim Kaine (D) | 0.04 | 276 | 355 | 44% | 2 | 5 | 29% | 7 | 20.25 | 5 | -19.25 |
| 8 | Hillary Clinton (D) | -0.48 | 221 | 471 | 32% | 0 | 7 | 0% | 8 | 15.08 | 8 | -32.89 |
Demographics
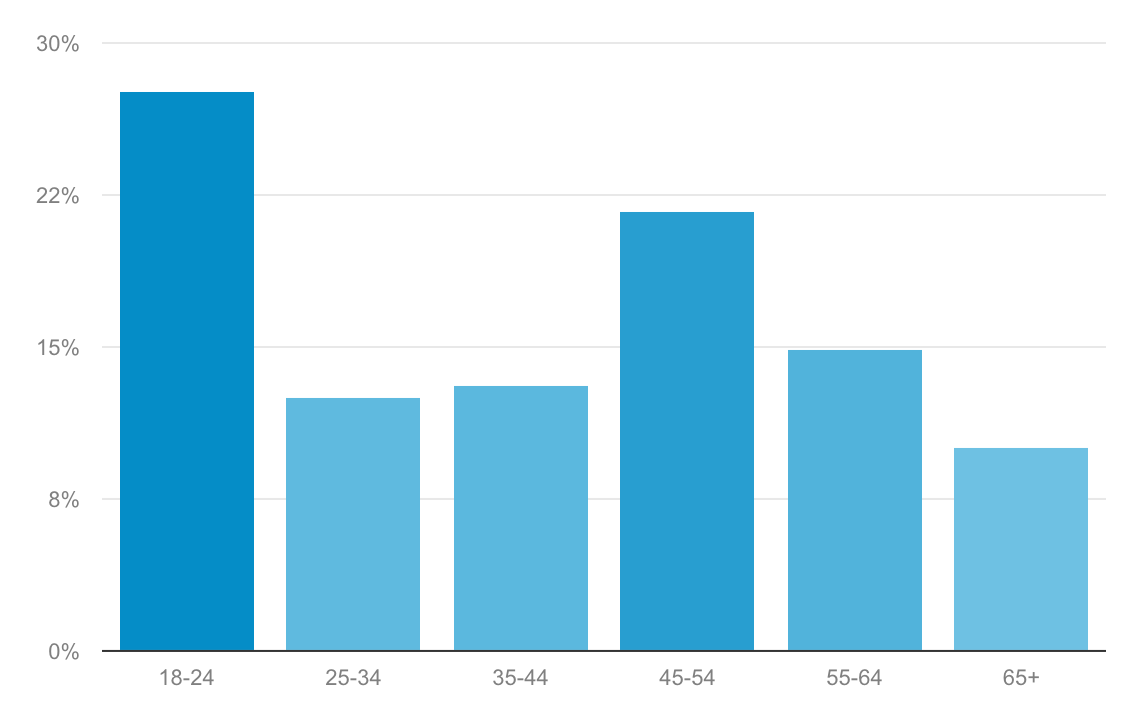
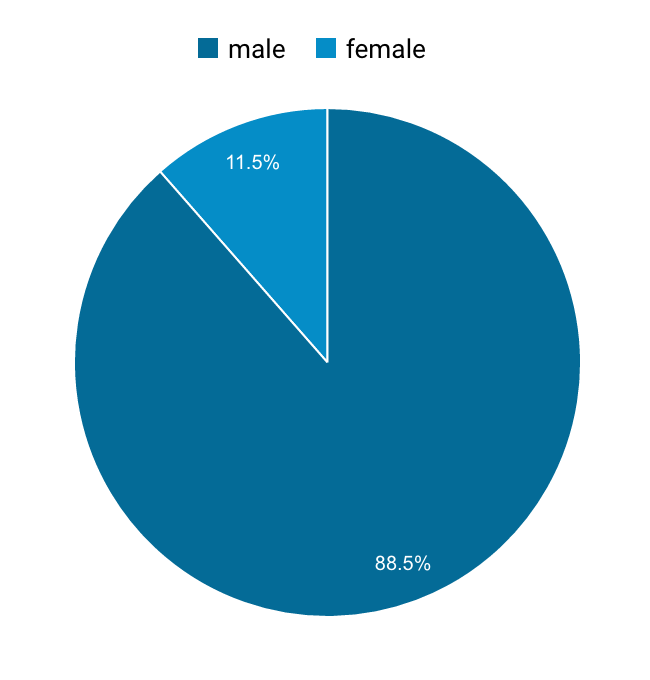
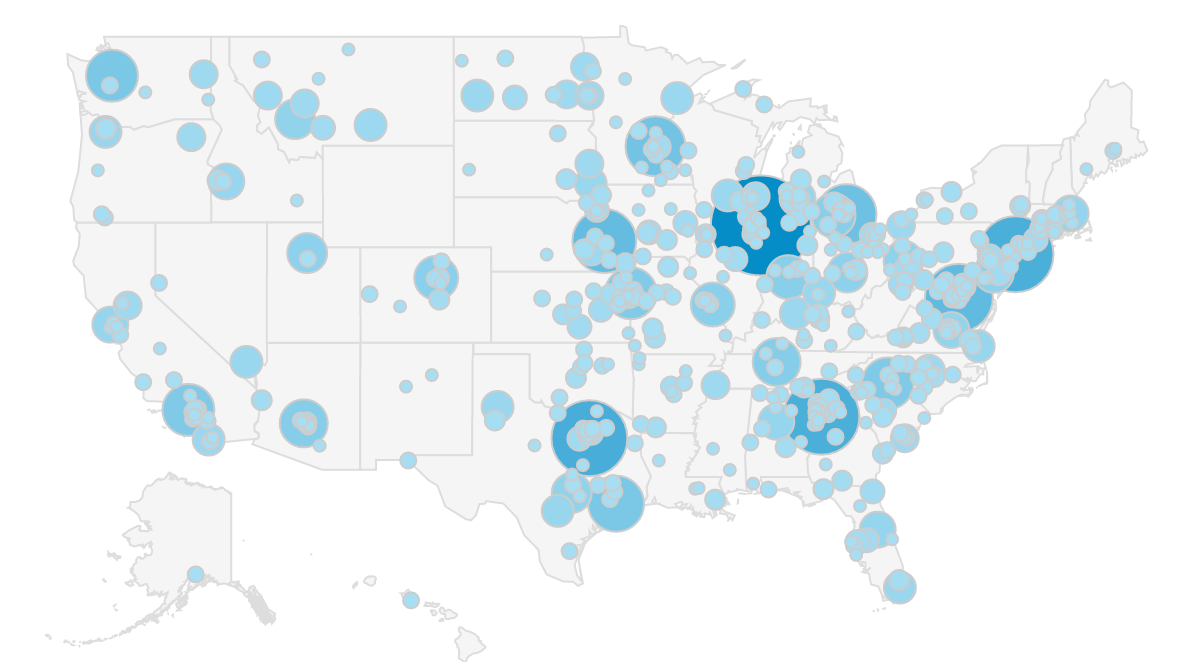
The following charts depict the demographics of the participants of the study. The vast majority of the partipants (about 89%) were male, which almost certainly skewed the results to some degree, as Hillary Clinton was attempting to become the first female US President. However, we were still able to validate that the "game theory" approach is useful in predicting voter sentiment.
Age
Gender
Location
Predicted Outcomes
Based on the votes of the study participants and subject to the stated demographics, the algorithm predicted the outcome of every possible matchup. Some of the highlights are listed in the table below:
| Matchup | Predicted Winner | Win Probability |
|---|---|---|
| Donald Trump (R) vs Hillary Clinton (D) | Donald Trump (R) | 64% |
| Mike Pence (R) vs Tim Kaine (D) | Mike Pence (R) | 63% |
| Barack Obama (D) vs Donald Trump (R) | Barack Obama (D) | 52% |
| Barack Obama (D) vs Hillary Clinton (D) | Barack Obama (D) | 67% |
Actual Results
Donald Trump received 304 electoral college votes and Hillary Clinton received 227. The number of electoral votes required to win was 270. Seven faithless electors, two pledged to Trump and five to Clinton, voted for other candidates. The model predicted a 314-224 win for Donald Trump.